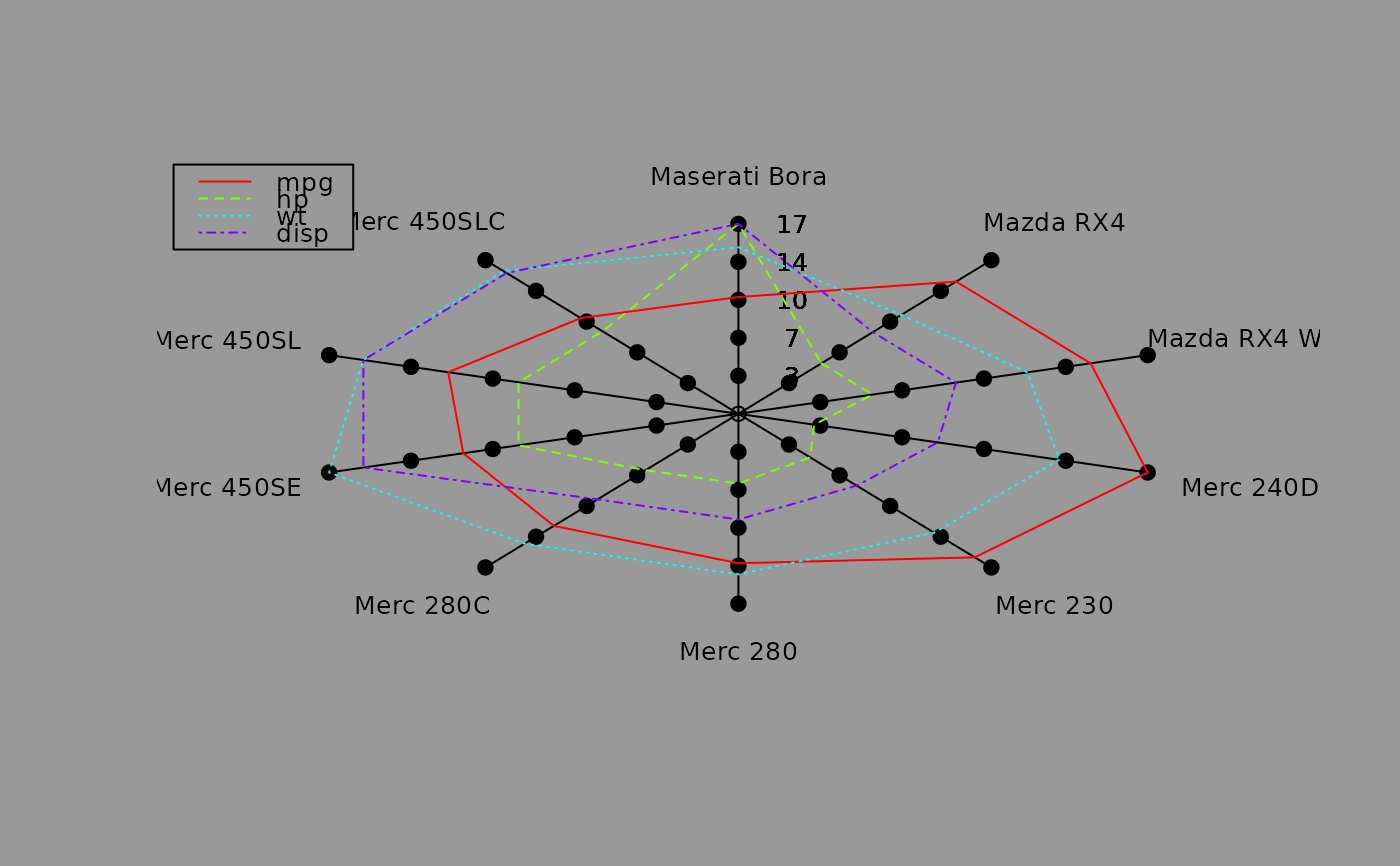
diamondplot displays a plot of polygons on a radial grid representing
the relationships between one or more attributes of data objects. For a slightly
different style of plot, see the "spiderweb plot" example in radial.plot.
Usage
diamondplot(x, bg=gray(0.6), col=rainbow,name="", ...)
Arguments
- x
A data frame containing numeric values that represent attributes
(possibly repeated observations) of data objects. See the example.
- bg
The background color for the plot.
- col
The colors for the polygons.
- name
The title for the plot (i.e. main).
- ...
additional arguments passed to plot.
Examples
 data(mtcars)
 mysubset<-mtcars[substr(dimnames(mtcars)[[1]],1,1)=="M",c("mpg","hp","wt","disp")]
 diamondplot(mysubset)

