Add an Inverse Rug to a Plot
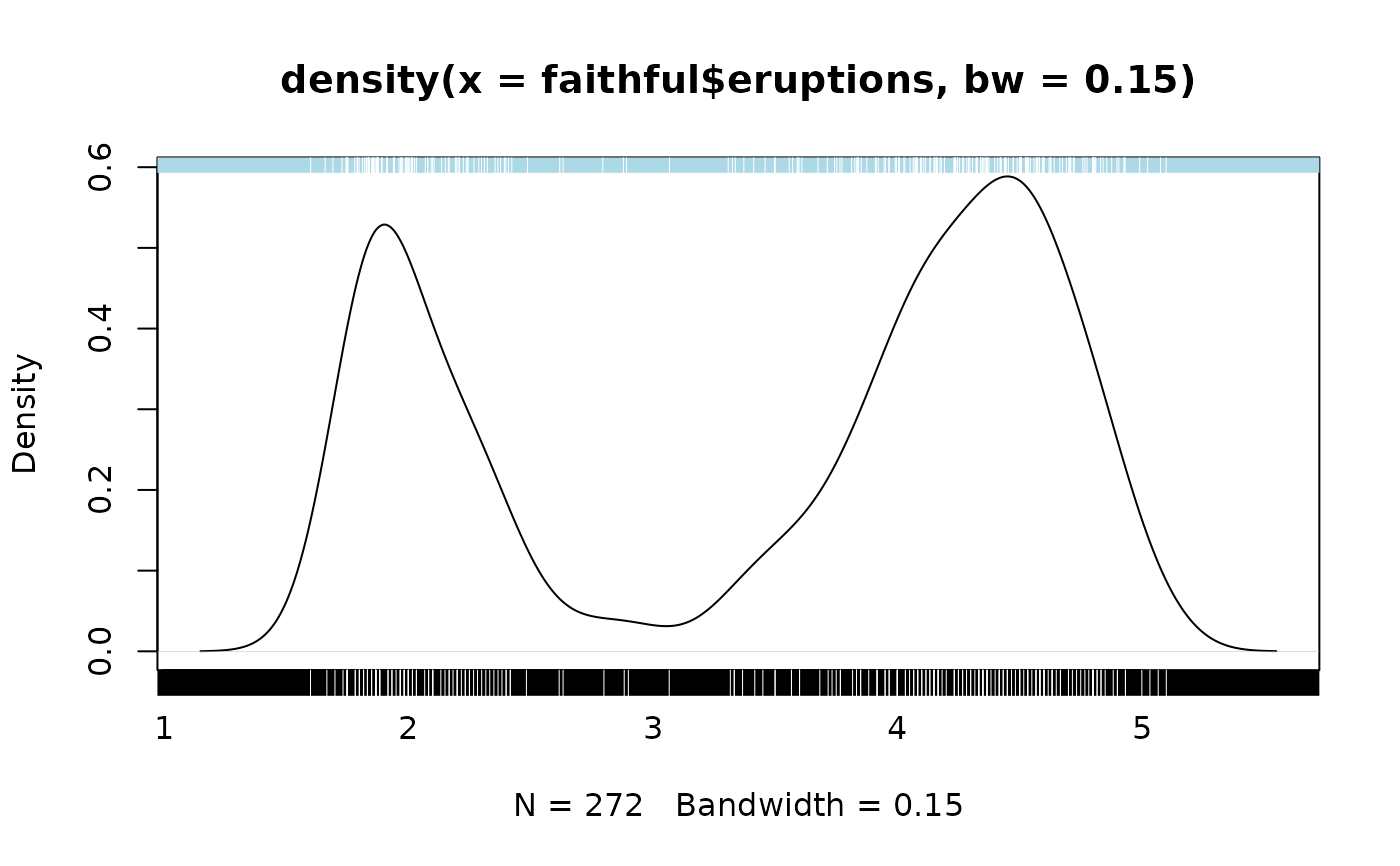
ruginv.RdAdds a rug representation (1D plot) of the data to the plot, but with the coloring inverted.
Arguments
- x
A numeric vector.
- ticksize
The length of the ticks making up the 'rug'. Positive lengths produce inward ticks.
- side
On which side of the plot box the rug will appear. Usually 1 (bottom) or 3 (top).
- lwd
The line width of the ticks.
- col
Color of the background of the ticks.
- col.ticks
The color of the ticks.
- quiet
Logical indicating if there should be a warning about clipped values.
- ...
Further arguments passed to polygon when plotting the background for the ticks.
