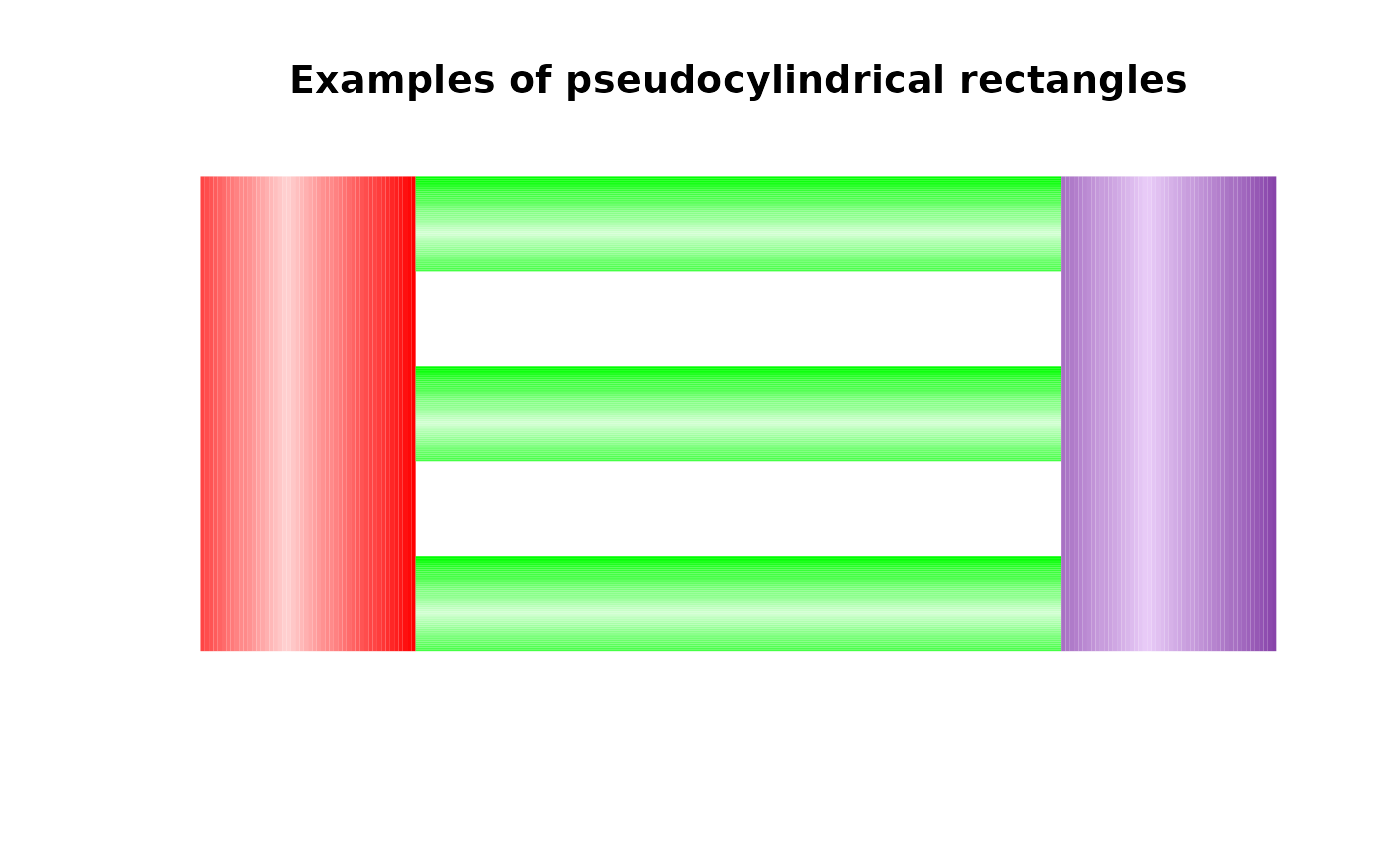
Display an apparent cylinder
cylindrect.RdDisplay rectangles shaded to appear like cylinders.
Arguments
- xleft
The position of the left side of the rectangle(s).
- ybottom
The position of the bottom of the rectangle(s).
- xright
The position of the right side of the rectangle(s).
- ytop
The position of the top side of the rectangle(s).
- col
The base color(s) of the rectangles.
- border
Whether to draw a border and what color.
- gradient
Whether to vary the shading horizontally ("x" - the default) or vertically (anything but "x").
- nslices
The number of "slices" of color for shading.
Details
cylindrect displays a rectangle filled with "slices" of color that simulate the appearance of a cylinder. The slices are calculated so that the base color appears at the right or bottom edge of the rectangle, becomes progressively lighter to a "highlight" at two thirds of the width or height and then darkens toward the base color again.
The appearance is of a cylinder lit from above and to the left of the viewer. The position of the apparent light source is hard coded into the function.
